What is an XLA? IT Experience Level Agreements Guide (2026)
XLA explained: what an Experience Level Agreement is, how it differs from an SLA, the five-step framework to implement one, and MSP contract guidance.

What is an XLA? A Practical Guide to Experience Level Agreements for IT Leaders
You run a strong service desk. Your SLA report is green. Response times, resolution rates, uptime, all inside target. Yet at the last board meeting, someone from finance mentioned IT support in a tone that suggested things weren't quite as healthy as your dashboard implied.
That gap between what your metrics show and what your users experience is what an Experience Level Agreement is designed to close.
The short answer: an Experience Level Agreement (XLA) is a commitment to measure and improve the outcomes users actually experience, not just the operational targets IT hits along the way. Where an SLA asks "did we meet the target?", an XLA asks "did the user get what they needed?" XLAs don't replace SLAs; they layer on top of them, adding a human-outcome view that traditional service metrics were never designed to capture. Done properly, an XLA is only as good as the ticket-level experience data feeding it, and that is where most IT teams still fall short.
For CIOs and IT leaders navigating the shift from output metrics to outcome metrics, the practical questions are the same ones you're already asking. What exactly is an XLA? How does it differ from an SLA in practice? What data do you need? How do you implement one without a two-year transformation programme? And how do you write XLAs into MSP contracts without creating a governance nightmare?
This guide answers all of it: a practical, source-based walkthrough of what XLAs are, why they've moved from analyst prediction to enterprise reality, and how to put one in place.
What is an XLA (Experience Level Agreement)?
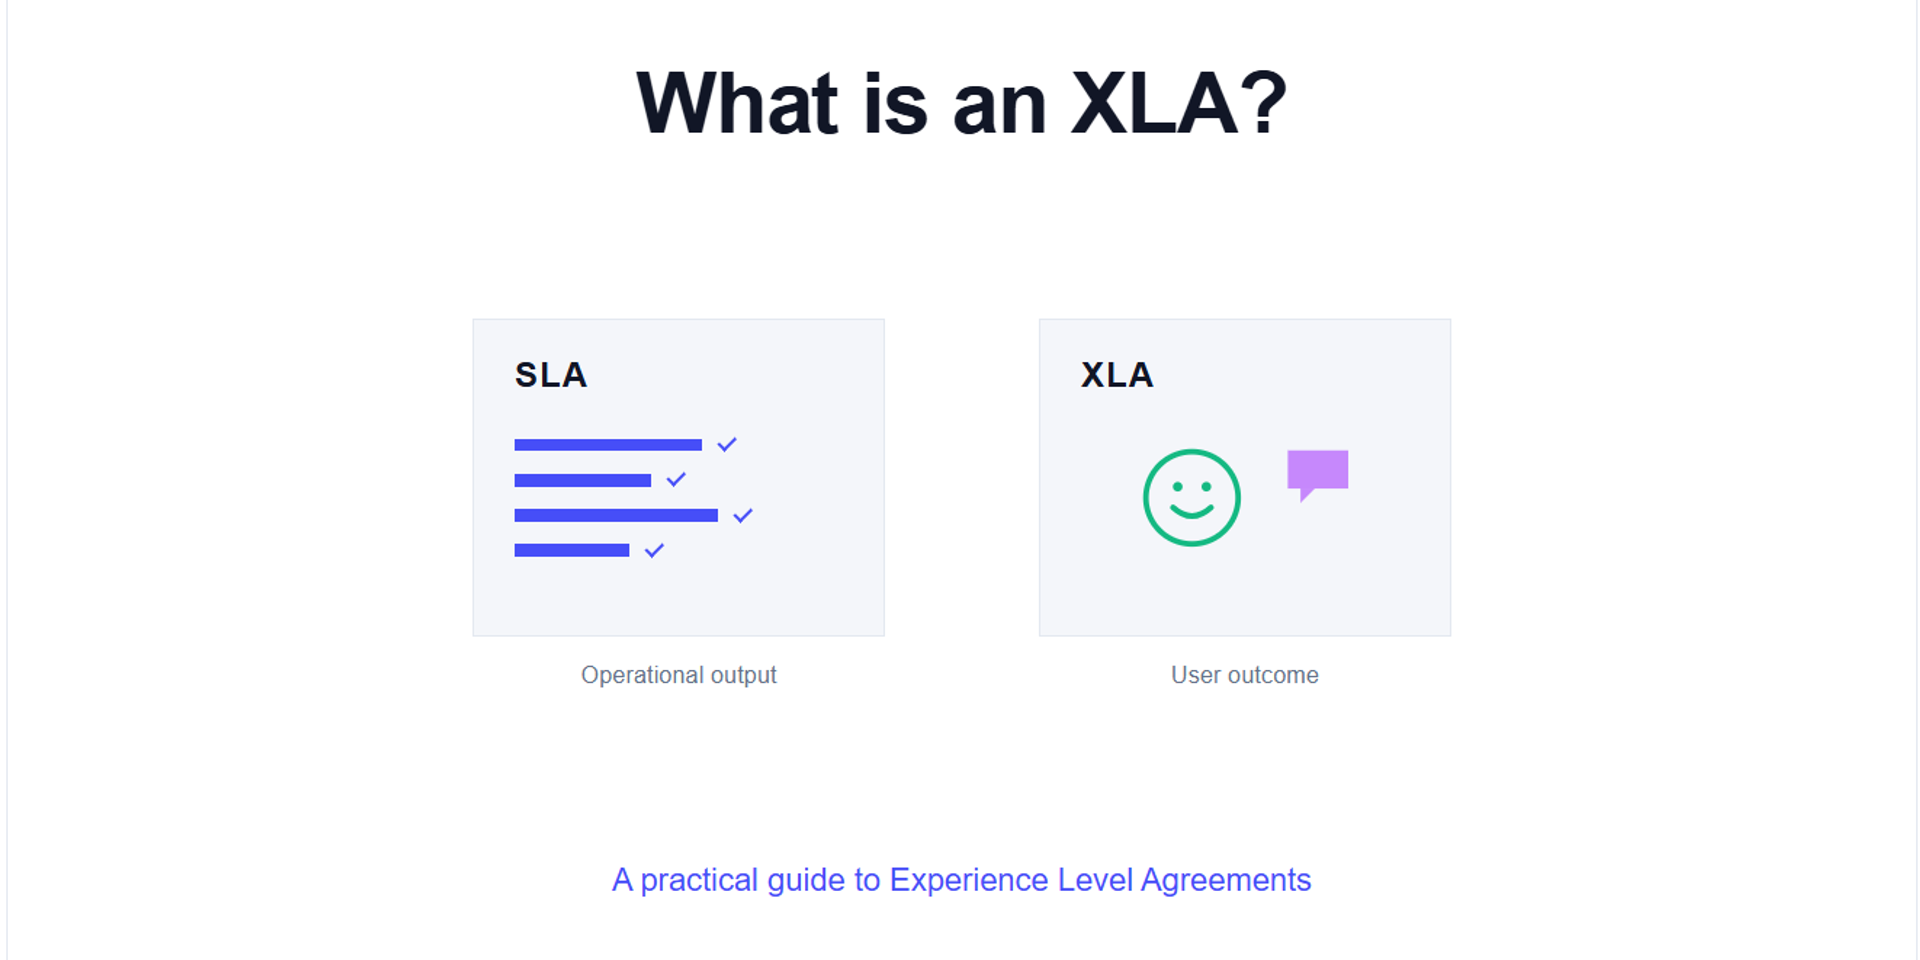
An Experience Level Agreement (XLA) is a formal commitment to measure and improve the quality of the user's experience of a service, rather than only the operational targets used to deliver it. Where a Service Level Agreement (SLA) tracks IT's outputs, an XLA tracks users' outcomes. The measurement is typically continuous, tied to real interactions, and reported against agreed experience targets rather than against uptime clocks.
Where the term comes from. XLA was coined by Giarte, an Amsterdam-based research and consultancy firm, most closely associated with its CEO Marco Gianotten. Giarte's own definition puts the difference simply: "an SLA is a contract, but an XLA is a commitment." Giarte describes an XLA as a guide rather than a judicial document, one that records goals from an end user's perspective and connects those goals to how IT is delivered. The framing has since been picked up by ITSM authorities including APMG International and ITIL 4 practitioners, and is referenced across analyst commentary on the shift from output-based to outcome-based service management.
What an XLA looks like in practice. A well-formed XLA has three ingredients: a defined user journey (for example, resolving a support ticket, or onboarding a new employee), a measurable outcome for that journey (satisfaction, effort, perceived lost time), and an agreed target the organisation commits to hit or improve towards. That structure is deliberately different from an SLA, which typically measures a technical target like "resolve P2 incidents within four business hours." An XLA on the same journey might commit instead to "sustain a ticket-level satisfaction score above 40 for the support journey."
XLA, SLA and DEX: how they fit together. Three terms tend to get mixed up in ITSM conversations, and the distinction matters:
- SLAs measure operational reliability, like response time, resolution time, uptime, and first-call resolution. They keep the machine running.
- XLAs measure the human outcome of that operational work, like satisfaction, effort, and productivity impact. They keep the humans supported.
- Digital Employee Experience (DEX) is a related but narrower discipline that measures the technical health of employees' digital environment (device performance, application responsiveness, network quality), typically through telemetry rather than surveys. DEX data often feeds into an XLA, but the two aren't the same thing.
Together, they form a layered view of IT performance: SLAs prove the service ran, DEX shows how well the technology performed underneath, and XLAs reveal whether any of it actually helped the person using it.
Why XLAs Exist: When Green Dashboards Hide a Red Experience
If your SLAs are green and your users are still frustrated, you already understand the problem XLAs are designed to solve. IT teams have spent two decades getting very good at measuring what's easy to measure: response time, resolution time, uptime, ticket volume. Those numbers keep the operational side of the service desk honest, but they don't tell you whether the person on the other end of the ticket got what they needed. That gap is where XLAs came from.
The scale of the gap isn't small. Independent research puts the cost of poor IT experience in the hundreds of hours per employee, per year. Nexthink's First Annual Workplace Productivity Report (2025) found the average enterprise loses 470,000 hours per year to poor digital employee experience, roughly equivalent to 226 full-time employees. Scalable Software's 2024 research put the individual figure at 5.5 hours lost per employee per week to digital friction, with 29% of workers citing poor digital experiences as a reason they've considered leaving their job. WalkMe's 2024 study, reported in CIO Magazine in March 2025, found the average large enterprise lost $104 million to digital inefficiencies in a single year, with employees averaging 36 lost workdays to IT roadblocks. Gallup's State of the Global Workplace 2025 estimates the wider engagement decline cost the global economy $438 billion in 2024 alone. Different studies, same message: the "green outside, red inside" problem has a measurable price.
None of that shows up in an SLA report. A ticket closed inside its four-hour target still counts as a success, even if the user had to log the ticket three times to get a fix that actually held. A system with 99.9% uptime still counts as reliable, even if the two 15-minute outages happened during the exact windows that block genuine work. SLAs weren't designed to measure any of that, and asking them to is unfair.
The industry has a name for the pattern. When the dashboard glows green but the user experience underneath is red, ITSM practitioners call it the watermelon effect, a term traceable back to Giarte's original commentary on SLA limitations. It's the single most common failure mode we see in mature service desks, and it's why XLAs have moved from analyst prediction to enterprise reality faster than most ITSM shifts.
(This is a fast overview; if you want the full anatomy of the watermelon effect, the productivity impact, and how to expose it in your own service desk, we've unpacked it in a dedicated guide to the watermelon effect in IT.)
XLA vs SLA: The Key Differences
An SLA measures whether IT hit its operational targets. An XLA measures whether the user actually got what they needed. Both are useful, and mature ITSM teams run them together: SLAs governing service reliability, XLAs governing the human outcome of that reliability. The clearest way to see the difference is side by side.
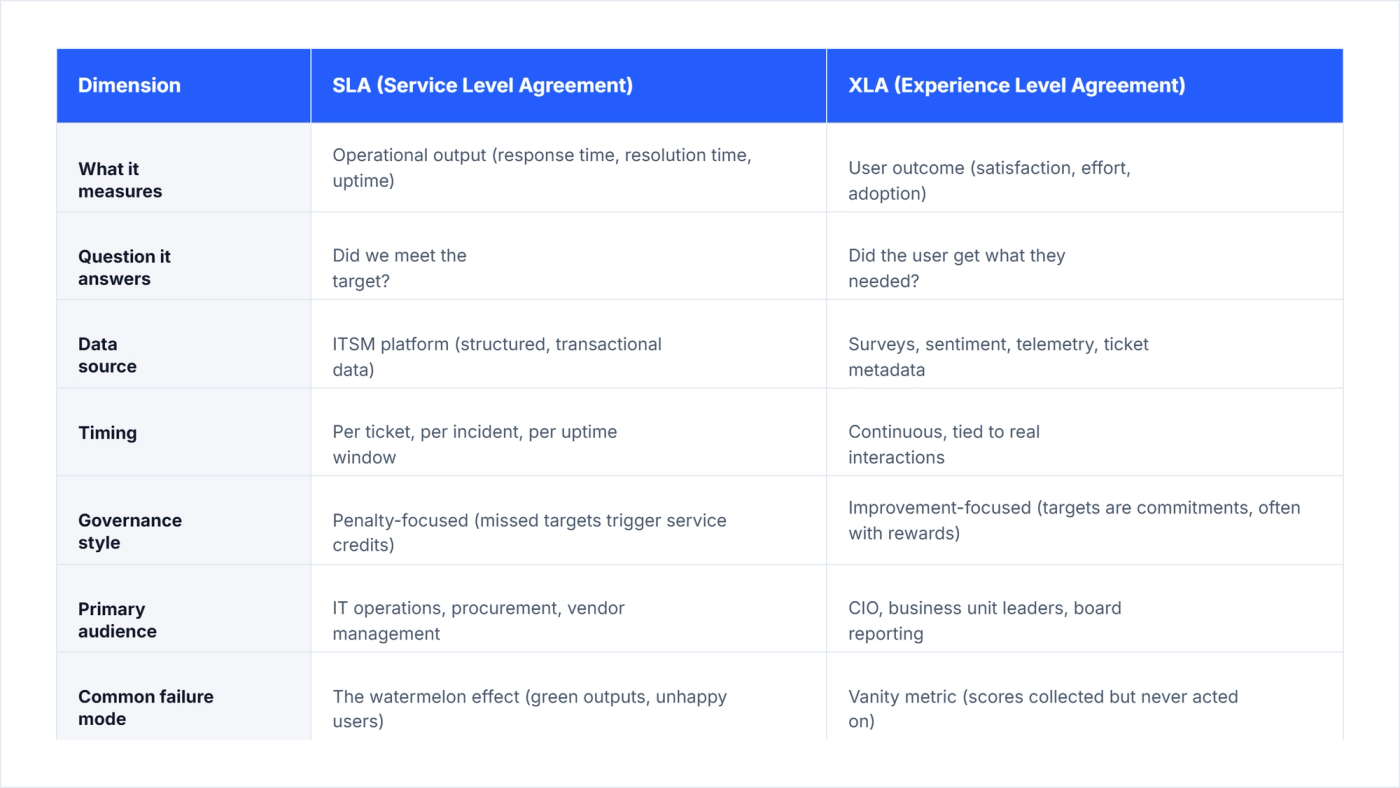
Reading the table. The most useful takeaway isn't any single row. It's that an SLA and an XLA answer different questions on different timelines with different data sources. They aren't competing measurements of the same thing. That's why every credible source in the ITSM community, from Giarte through ITIL 4 practitioners to CIO Magazine commentary, agrees that XLAs complement SLAs rather than replace them.
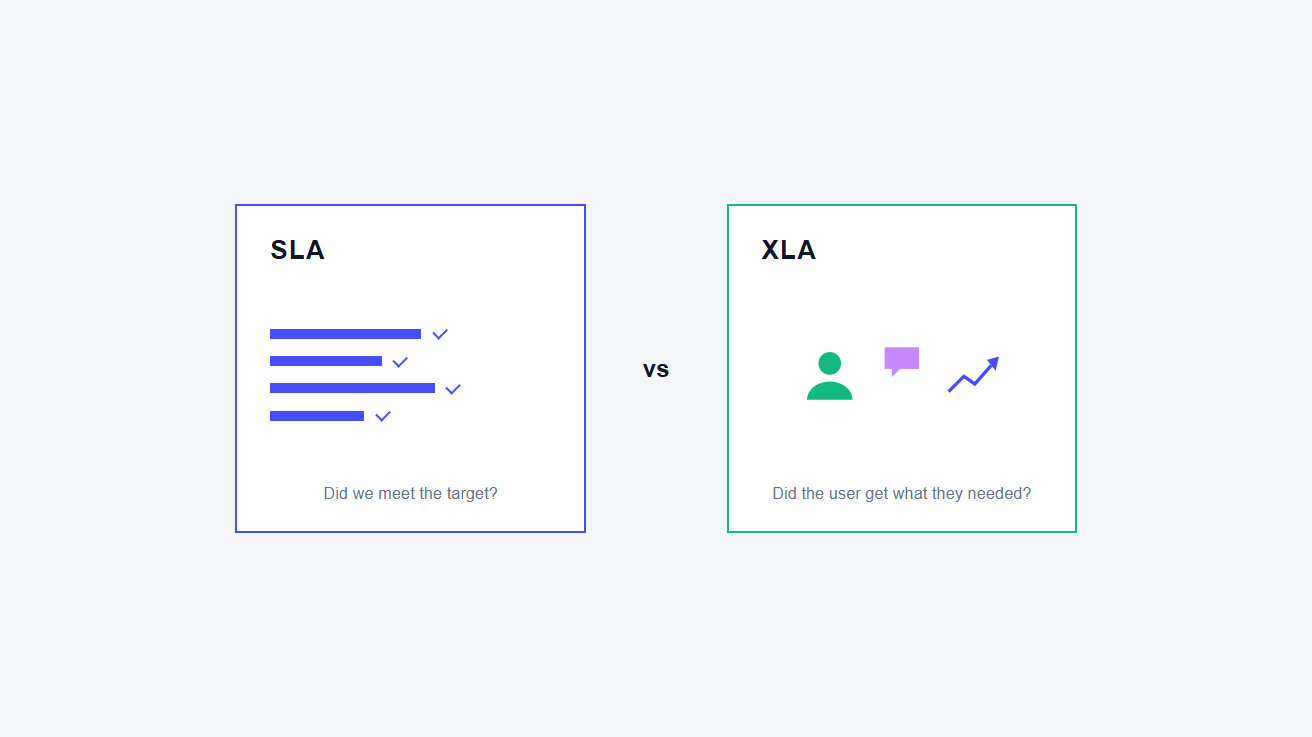
A concrete scenario. A senior manager submits a P2 ticket at 9am: her laptop won't sync to the meeting she's presenting to the executive team at 11am. The service desk responds at 9:14am (SLA green), assigns the ticket, and closes it at 12:47pm with a "resolved" tag (SLA green, well inside the four-hour target). The dashboard shows two greens. What the dashboard doesn't show: she presented on a colleague's laptop, badly, because the ticket bounced between three teams and the fix only landed after the meeting. From an SLA point of view, the service desk did its job. From an XLA point of view, the outcome she cared about was already lost by 11:01am. Both statements are true. Only one of them is the one the CFO remembers when the IT budget conversation comes up next quarter.
That gap between technically-met SLAs and business-relevant outcomes is what an XLA measurement layer is designed to close: not by discarding operational metrics, but by adding an honest signal from the person the service is actually for.
What Goes Into a Good XLA: The Data Layer
An XLA is only useful if the data behind it is honest. That means combining several data types, each answering a different question, and attaching them to a specific moment in the user's journey with IT. The right mixture varies by organisation, but the four categories below are what most mature XLA programmes are built on.
1. Experience data (from the user). Feedback captured directly from the person the service was for. This is usually a short survey triggered by a specific event: a resolved ticket, a completed request, an onboarding milestone. The scoring model matters here. A generous 1-to-5 satisfaction rating that treats a lukewarm 4 as "satisfied" produces flatter, less useful data than a stricter model that separates enthusiasts from the merely-tolerated. This is why NPS, applied at the ticket level, has become the preferred experience signal for many XLA programmes: its scoring is deliberately demanding, and detractors are called out by design rather than hidden in an average. (If you want the full comparison of CSAT, NPS and CES for a service desk, we've covered it in a dedicated guide to choosing the right satisfaction metric.)
2. Operational data (from the ITSM). Ticket-level metadata from the service management platform: which ticket, which agent, which support team, resolution time, reassignment count, reopen count, category. This is the layer that lets an XLA score be interrogated. A raw "satisfaction is down this month" number is almost useless. A satisfaction score attached to this ticket, from this agent, in this team, that was reassigned twice is a coaching conversation.
3. Sentiment data (from open-text comments). The free-text field on the survey is where the reason lives. Manually reading hundreds of comments per week isn't realistic for any service desk, so AI-based sentiment and theme detection has become standard. Applied properly, sentiment analysis surfaces recurring language patterns ("waited all day," "had to reboot three times," "helpful but slow") and turns them into quantifiable themes that a service desk manager can actually act on.
4. Telemetry data (from the environment). Optional, but increasingly common. Digital Experience Monitoring platforms capture the technical health of the user's device, application, and network activity. Combined with experience and operational data, telemetry helps distinguish "the user rated us badly because our agent was rude" from "the user rated us badly because their VPN dropped mid-fix."
One principle underpins all four: every data point must be attributable to a specific interaction. An XLA score that averages across an entire quarter, an entire business unit, and an entire service catalogue tells you almost nothing. The value is in the granularity, which means whichever platform you use to run your XLA programme has to attach every score, every comment, and every sentiment reading to the ticket, agent, and team it came from. That's the difference between an XLA measurement platform and a generic survey tool.
How to Implement an XLA in IT: A Five-Step Framework
You don't need a two-year transformation programme to get an XLA into production. The most successful implementations we've seen start small: one journey, one commitment, one measurement, then expand. The five-step framework below is drawn from published guidance in the ITSM community (Giarte, TaUB Solutions, SMC Consulting, and CIO Magazine's June 2026 XLA coverage) and mirrors how mature IT teams actually roll experience management out.
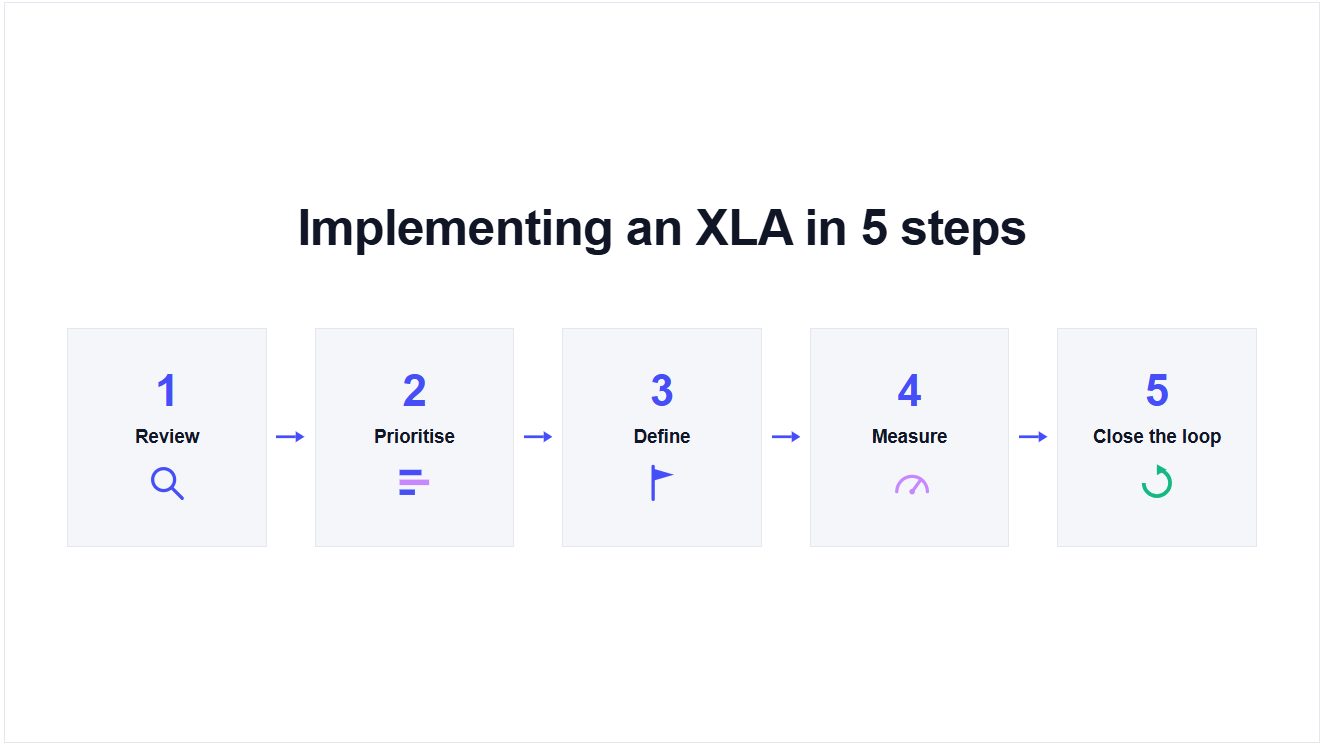
Step 1: Review the current experience. Before you can commit to improving anything, you need an honest read of where you are today. Pull the last six months of ticket data alongside whatever satisfaction data you already have (even if it's patchy), and look for the friction. Which journeys generate the most tickets? Where are reassignments and reopens concentrated? Where are the anecdotes coming from? This is where the watermelon effect gets exposed, and it's the baseline every later step will be measured against.
Step 2: Filter and prioritise. Not every journey should become an XLA on day one. Pick two or three where the gap between operational performance and user experience is largest, or where the business impact of getting it right is clearest. Common starting points: incident support for critical business users, new-starter onboarding, and self-service portal requests. Keep the initial scope narrow enough that you can be seen to succeed inside a quarter.
Step 3: Define the ambition. For each priority journey, write down what "good" actually looks like from the user's point of view. Not "resolve within four hours," but "the user felt supported and got back to work quickly." Then translate that ambition into a measurable target: a satisfaction score, an effort score, a productivity threshold. The target should be a commitment to improve towards, not a static line to defend. Reward hitting it; don't penalise missing it (this distinction, well established in the ITSM literature, is what stops XLAs turning into another set of penalty clauses).
Step 4: Choose the measurement. Match the metric to the moment. For a resolved ticket, transactional NPS gives you the demanding signal a service desk needs. For a self-service portal or provisioning journey, Customer Effort Score is often the better fit. For quarterly organisation-wide pulse checks, relational NPS still has a role. Combine subjective signals (from the user) with objective ones (from the ITSM) so a low score can be diagnosed, not just recorded.
Step 5: Close the loop. This is where most XLA programmes fail: they measure, they report, and then nothing changes. Build in a review cadence from day one. Weekly working sessions to surface friction themes, monthly stakeholder reviews to track trend against target, quarterly ambition reviews to adjust the target as expectations shift. And treat detractor scores as live signals: a poor rating should trigger a follow-up conversation, not sit in a spreadsheet until month-end.
The framework is deliberately simple because the hard part isn't the model. It's the discipline of running the loop consistently, quarter after quarter, until the experience data is as trusted as the SLA data was before it.
SLA to XLA Migration: A Practical Guide
Migrating from SLAs to XLAs isn't a rip-and-replace exercise. Every credible source in the ITSM community, from Giarte through CIO Magazine, is clear on this: SLAs stay, XLAs layer on top. You're adding an experience measurement layer to a governance model that already works operationally, then gradually rebalancing which numbers get taken seriously at review meetings. There are three ways to run that migration, and one is significantly less risky than the others.
Approach 1: Incremental (recommended). Add an XLA to one journey, prove the value, then extend. Pick a journey where the watermelon effect is most visible (usually incident support or new-starter onboarding), add a short satisfaction survey at the closure point, run it for two to three months alongside the existing SLAs, and compare. The comparison is usually persuasive enough that executive sponsors ask you to expand. Timeline to first XLA in production: three to six months.
Approach 2: Dual-run. Keep SLAs and XLAs running in parallel for six to twelve months across the whole portfolio, reporting both at the same governance forums. Heavier on effort, but useful in mature enterprises where formal service-review culture is already the norm. Common in outsourced environments where contract terms need to be renegotiated at renewal.
Approach 3: Big bang. Swap SLAs for XLAs wholesale. No credible source recommends this. The only legitimate use case is a greenfield ITSM implementation where no SLAs exist yet.
The MSP contract question. For anyone with outsourced IT support, this is where XLA migration gets both more important and more delicate. Greg Hall, writing in CIO Magazine in June 2026, put it bluntly: "MSPs can deliver experience-based outcomes, but they rarely prioritise them unless contracts demand it." Hall goes further:
"I've seen MSPs manage the measurement platform and report improving scores, only for independent measurement to reveal a very different reality. The strongest XLA programmes treat experience data as jointly owned, openly shared, and central to collaborative problem-solving."
The implication for anyone renegotiating an MSP contract is direct: the measurement platform matters as much as the metric itself. An MSP grading its own experience data is a structural conflict of interest, no matter how honest the individuals involved are. Independent measurement, where the platform is operated separately from the party being measured, is what turns an XLA from a nice-to-have clause into a governance mechanism the client can actually enforce.
Two practical warnings. First, reward good performance rather than penalise poor performance, at least in the first year of an XLA programme. Penalty clauses tied to uncalibrated targets damage the client-MSP relationship without improving user experience. Second, and echoing Hall in CIO Magazine: "you can't set meaningful experience targets without knowing where you're starting from." If you're running SLA-only contracts with no experience data, spend the first three months collecting a baseline before writing any XLA into a contract.
Common Pitfalls of XLA Management
Most XLA programmes don't fail because the framework is wrong. They fail because of one of the same six mistakes, all avoidable:
- Measurement fatigue. Surveying every ticket, every request, every interaction until users stop responding. Cap survey frequency; the ITSM industry norm is no more than once per person every four weeks.
- Gaming the metric. Closing tickets fast to protect a satisfaction average, rather than fixing the underlying issue. A rising score with a rising reopen rate is a red flag, not a win.
- Vanity metric trap. Collecting XLA data but never acting on it. If your monthly XLA report doesn't change someone's Monday, you're running a survey programme, not an experience programme.
- Journey blindness. Reporting one blended XLA number across incident support, provisioning, onboarding, and self-service. The blend hides the friction; segment the data by journey.
- Wrong metric for the moment. Running an NPS survey after a password reset, or a CES survey after a strategic project. Match the metric to the interaction, not to the tool you happen to have.
- Ripping and replacing SLAs. Every credible source agrees this is a mistake. XLAs are additive; the SLA layer stays in place.
The pattern across all six: teams treat XLA management as a measurement problem when it's really a governance problem. The measurement is the easy part.
How ciopulse Fits Into an XLA Programme
An XLA is only as good as the experience data feeding it, and that data has three demands: it must attach to a specific ticket, be interrogatable down to the agent and team, and move fast enough to trigger action while the interaction is fresh. That's what ciopulse is built for.
When a ticket is resolved in your ITSM platform, whether ServiceNow, Jira Service Management, Zendesk, or any other, your ITSM sends the user a short ciopulse survey link as part of its normal closure notification. ciopulse hosts the survey page, captures the response, and matches it back to the ticket, agent, and team. The survey takes under two minutes and requires no login. The result is experience data attributable to real interactions, ready to feed an XLA target.
A few things worth knowing. The primary metric is NPS, applied transactionally at the ticket level, with CSAT reporting available alongside. Detractor ratings (0 to 6) trigger same-day Service Recovery alerts to the support lead by SMS and email, so a poor rating gets a follow-up while the ticket memory is fresh. PulseAI, ciopulse's opt-in AI feature, summarises open-text feedback at the aggregate level (monthly per client) to surface recurring themes without a human reading every comment.
ciopulse works with any ITSM platform that can include a URL in its closure notification, with a certified app on the ServiceNow Store for the simplest setup. It's a ServiceNow Select Partner and an AWS Partner, with all customer data resident in AWS ap-southeast-2 (Sydney).
Frequently Asked Questions
What is an XLA in simple terms?
An Experience Level Agreement (XLA) is a commitment to measure and improve the user's actual experience of an IT service, rather than only the operational targets IT hits along the way. An SLA asks whether the service ran; an XLA asks whether the user got what they needed.
Do XLAs replace SLAs?
No. Every credible source in the ITSM community, from Giarte to CIO Magazine, agrees XLAs complement SLAs rather than replace them. SLAs govern operational reliability; XLAs govern the human outcome of that reliability. Mature IT teams run both.
How long does it take to implement an XLA?
Three to six months to a first XLA in production if you start incrementally: one journey, one target, one measurement layer. Full-portfolio migration typically runs across a multi-year programme, especially in outsourced environments where MSP contracts need renegotiation.
What metric should an XLA use?
Match the metric to the moment. For post-ticket support, transactional NPS is the strongest signal. For self-service and provisioning journeys, Customer Effort Score fits better. For organisation-wide periodic pulses, relational NPS still has a role. Most mature XLA programmes combine two or three.
How do XLAs work in an MSP contract?
As additional experience clauses layered onto the existing SLA framework, rewarded rather than penalised in the first year, and measured on an independently operated platform to avoid the conflict of an MSP grading its own experience data.
See ciopulse in action
Real-time IT satisfaction feedback that integrates with any ITSM platform. Book a 15-minute demo and see how it works.
BOOK A DEMO