The Watermelon Effect: Why Green IT SLAs Hide Red UX
Your SLA dashboard is all green while your users stay frustrated. That gap is the Watermelon Effect, and here is how to measure the red user experience your metrics are hiding.


Your SLA dashboard is a sea of green. Ticket response times look strong. Resolution rates are high. On paper, your IT service desk looks like a model of efficiency.
So why are people still unhappy?
If the reports say everything is working, but staff keep complaining about slow, rushed, or frustrating support, you may be dealing with the Watermelon Effect in IT.
Green on the outside. Red on the inside.
It is the disconnect between service level dashboards that look healthy and the actual user experience underneath. Your metrics say performance is strong. Your users are telling a different story.
This is not just a quirky industry phrase. It is a serious blind spot that can cost organisations in lost productivity, lower trust, poor service perception, and weak vendor accountability. Below is a practical way to understand the problem, measure it properly, and move beyond SLA-only reporting.
SLA dashboard vs. actual user satisfaction: the source of the green watermelon
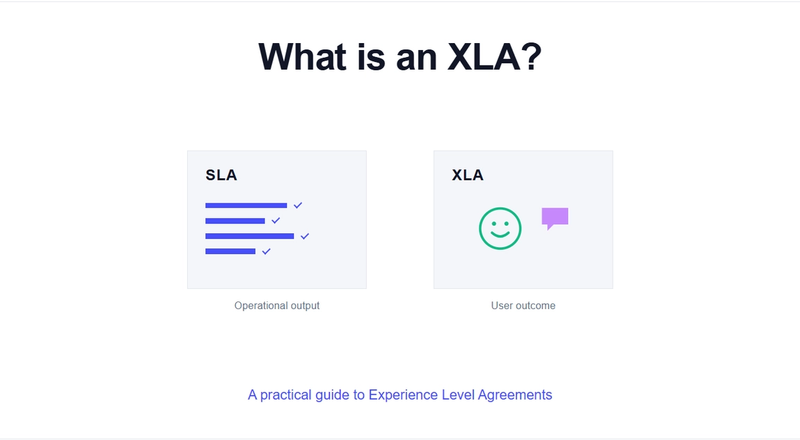
The core issue is simple: traditional SLAs were designed to measure operational output, not human experience.
They answer questions like:
- How quickly did we respond?
- Was the ticket closed within the agreed timeframe?
- Did the system remain available?
- How many tickets did the team process?
Those questions matter. But they miss something just as important:
- Did the user feel heard?
- Was the issue actually resolved from their point of view?
- Did the interaction restore productivity?
- Did the experience build trust in IT or reduce it?
That is the gap between SLA performance and actual user satisfaction. Here is how the green watermelon problem plays out in the real world:
- Dashboard shows 98% first-call resolution. The reality: the agent was dismissive, did not listen, and the user felt rushed.
- Dashboard shows the ticket resolved in under 4 hours. The reality: it took three attempts, two reboots, and a follow-up call from the user to get it working.
- Dashboard shows high agent utilisation. The reality: agents close tickets so fast that they never fix the root cause, so the same issues keep coming back.
- Dashboard shows 99.5% system uptime. The reality: the VPN was so slow it was unusable, blocking remote staff from critical files.
None of those metrics are necessarily false. They are just incomplete.
SLAs are not inherently bad. They are essential for setting expectations around response times, resolution targets, and system availability. The problem starts when organisations rely on them as the only measure of IT service quality.
Relying only on SLAs is like judging a restaurant by how quickly food leaves the kitchen, without asking whether customers enjoyed the meal.
A ticket can be closed on time and still leave the user frustrated. A system can be technically available and still be painful to use. An agent can meet every process requirement and still deliver a poor experience. That is where the Watermelon Effect begins.
The hidden costs of a green watermelon IT service
Ignoring the red beneath the green surface is not just bad for morale. It has real operational and financial consequences. When actual user experience is poor, the impact spreads across the organisation.
1. Productivity loss adds up quietly
A resolved ticket does not always mean productivity has been restored. An employee may still lose half a day waiting, retrying, explaining the issue again, or working around a partial fix. That lost time rarely appears in a standard SLA report.
According to ITIC research, a single hour of downtime can cost large enterprises hundreds of thousands of dollars. Not every IT support issue creates full downtime, of course. But smaller losses from slow responses, repeat incidents, poor communication, and incomplete fixes add up quickly. For example:
- 500 employees each losing 30 minutes a month to poor IT experience equals 250 lost hours a month.
- 1,000 employees each losing 20 minutes a month equals more than 330 lost hours a month.
- 2,000 employees each losing 15 minutes a month equals 500 lost hours a month.
You will not see that in a traditional SLA dashboard. That is why measuring hours lost per IT ticket matters. It gives IT leaders a clearer view of the business impact behind service experience.
2. Eroded trust and the rise of shadow IT
When employees feel IT is slow, unhelpful, or difficult to deal with, they adapt:
- They download their own tools.
- They move files into personal cloud storage.
- They bypass official request channels.
- They ask a colleague for a workaround instead of logging a ticket.
This is how shadow IT grows. Most employees are not trying to create security risk. They are trying to get their work done. But the result is still dangerous: less visibility, weaker governance, more compliance exposure, and a growing gap between official IT processes and how people actually work.
Shadow IT is often a trust problem before it becomes a technology problem.
3. A widening MSP accountability gap
The Watermelon Effect becomes especially risky when IT support is outsourced. Your Managed Service Provider, or MSP, may present a strong SLA report showing that every contractual target has been met. Response times are green. Resolution times are green. Ticket volumes are under control.
But are your people actually satisfied with the service?
Without independent data on the customer experience behind the outsourced service level, it is difficult to challenge the story presented in vendor reports. You may have complaints, anecdotes, and hallway feedback, but those are hard to use in a formal contract review. You need data. You need to know whether the MSP is simply meeting technical obligations or genuinely delivering a positive support experience.
Moving beyond the watermelon: from SLAs to XLAs
So how do you fix a problem your current metrics cannot fully see? You need a broader lens.
SLAs are not useless. You still need response time targets, uptime commitments, and resolution agreements. They provide structure and accountability. But they are not enough on their own. That is where Experience Level Agreements, or XLAs, take the spotlight.
XLAs do not replace operational metrics. They add human-centred experience data to them. Instead of only asking whether the process was completed, XLAs ask whether the service actually worked for the person receiving it:
- SLA asks: was the ticket closed? XLA asks: did the employee feel supported?
- SLA asks: did we meet the timeframe? XLA asks: was productivity restored quickly?
- SLA asks: was the system available? XLA asks: was the system usable?
- SLA asks: did the agent follow the process? XLA asks: did the interaction build trust?
When you combine both, you get a far more realistic view of IT service performance.
Without experience data, you are managing optics. With experience data, you are managing impact.
4 practical steps to start measuring real IT experience
You do not need a huge transformation programme to start seeing beyond the green dashboard. You can begin with a few practical steps.
1. Capture feedback at the point of service
Annual or quarterly surveys are usually too late to be useful for service improvement. By the time feedback is collected, the user has forgotten the details, the issue has gone cold, and the data is difficult to connect to a specific ticket or agent.
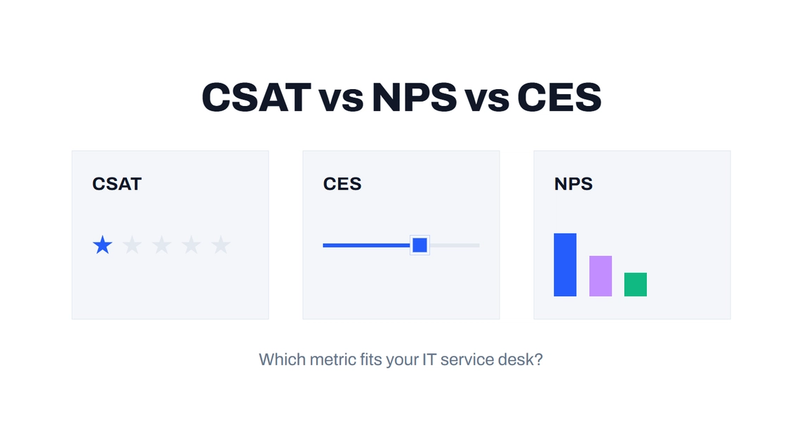
A better approach is to trigger a short satisfaction survey immediately after an IT ticket is closed. This gives you feedback that is timely, specific, connected to the ticket, connected to the agent or team, and easier to act on. A simple post-ticket satisfaction survey, ideally NPS, so lukewarm ratings don't inflate your score, can reveal what SLA dashboards miss.
2. Implement a detractor recovery process in your ITSM
Negative feedback should not sit unnoticed in a spreadsheet. If someone leaves a poor rating, that is a live signal. It means the experience failed in some way, even if the ticket was technically resolved.
A defined detractor recovery workflow can alert a team lead as soon as negative feedback is received. The team can then reopen the ticket, contact the user, and resolve the issue properly. Fast follow-up can repair trust before frustration spreads. A poor score is not just a complaint. It is an opportunity to recover the relationship.
3. Analyse the why behind the score
The score tells you something happened. The comments tell you why. Open-text feedback often contains the most useful insight, such as:
- "The fix worked, but communication was poor."
- "The same VPN issue keeps happening."
- "I waited all day and had to chase for an update."
- "The agent was helpful, but the process was confusing."
The problem is scale. No service desk manager has time to manually read hundreds of comments every week. That is where sentiment analysis and theme detection become valuable. They help surface recurring problems before they turn into larger complaints or escalations.
4. Quantify the business impact
If you want executive attention, quantify impact. Add a question asking users how much work time they estimate was lost because of the issue. That is how you begin serious measurement of hours lost per IT ticket. For example:
- Password reset delays, 180 hours last quarter. May justify self-service investment.
- VPN performance issues, 300 hours last quarter. May require an infrastructure review.
- Slow laptop provisioning, 120 hours last quarter. May indicate process bottlenecks.
- Repeated application errors, 250 hours last quarter. May require root cause analysis.
When you can say, "Recurring password reset issues cost us 180 hours last quarter," the conversation changes. You are no longer talking only about satisfaction. You are talking about productivity, cost, and business impact.
It is time to cut open the watermelon
For too long, IT leaders have had to defend green dashboards while knowing the reality was more complicated. The Watermelon Effect gives that frustration a name.
Your SLA metrics may be accurate, but they may not be complete. They can show that work was processed without showing whether the service experience was good, whether productivity was restored, or whether users trust IT more than they did before.
By shifting from purely operational metrics to a balanced view that includes user experience, IT leaders get a clearer picture of service performance. They gain the data to coach teams, improve processes, hold vendors accountable, and prove the value of IT in language the business understands.
Stop managing only the green. Start measuring what is happening underneath.
See ciopulse in action
Real-time IT satisfaction feedback that integrates with any ITSM platform. Book a 15-minute demo and see how it works.
BOOK A DEMO